
If you’re serious about Bitcoin trading, understanding how to read trading charts is crucial. Bitcoin charts provide valuable information that can help traders make informed decisions and predict market movements.
Whether you’re a novice or an experienced trader, mastering the basics of Bitcoin charts can greatly enhance your trading strategy.
In this article, we’ll break down the most common types of Bitcoin trading charts and indicators, as well as how to interpret them.
1. Types of Bitcoin Trading Charts
Candlestick Charts
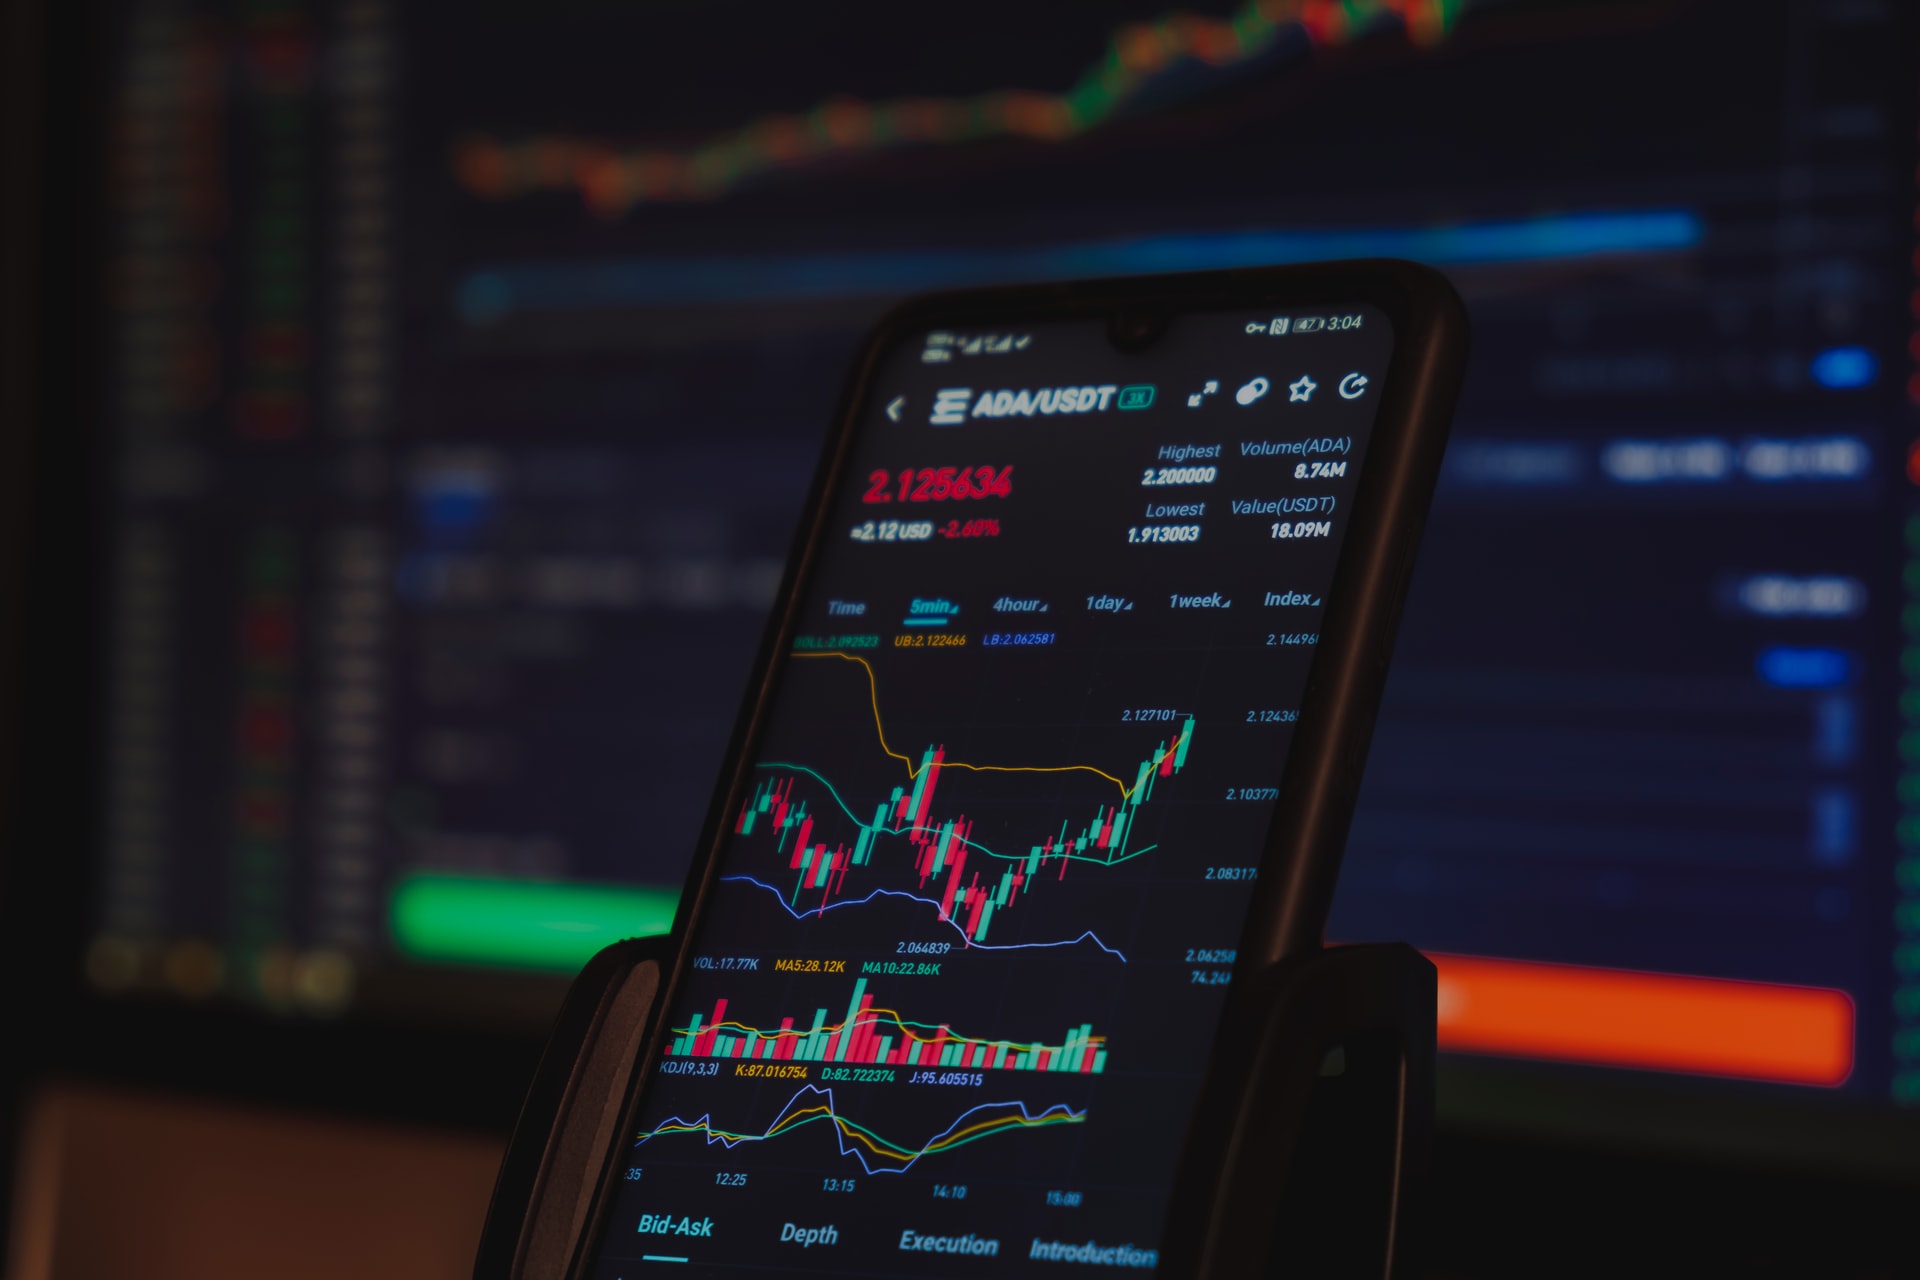
Candlestick charts are the most widely used in cryptocurrency trading. They provide a clear and detailed view of Bitcoin’s price movements within a given period. Each candlestick represents a specific time frame, such as 1 minute, 1 hour, or 1 day, and shows four key prices:
- Open: The price at the beginning of the time period.
- Close: The price at the end of the time period.
- High: The highest price reached during the time period.
- Low: The lowest price reached during the time period.
How to Read:
- A green (or white) candlestick means that the closing price is higher than the opening price, indicating a bullish period (price increase).
- A red (or black) candlestick indicates that the closing price is lower than the opening price, signaling a bearish period (price decrease).
Line Charts
Line charts are the simplest type of chart. They plot the closing prices of Bitcoin over a selected time frame and connect them with a line. While they don’t provide as much information as candlestick charts, they are useful for identifying overall trends.
How to Read:
- A rising line indicates that the price is going up, while a falling line indicates a price drop.
- Line charts are best for getting a quick overview of the market’s general direction but should be supplemented with more detailed charts.
Bar Charts
Bar charts, like candlestick charts, display the open, close, high, and low prices for a specific time period. However, they use vertical bars instead of candlesticks.
How to Read:
- The top of the bar represents the high price, the bottom represents the low price, a horizontal dash on the left indicates the opening price, and a dash on the right shows the closing price.
2. Key Bitcoin Chart Indicators
To make better trading decisions, traders use various indicators to analyze Bitcoin price charts. Here are the most common ones:
Moving Averages (MA)
Moving Averages smooth out price data to help identify trends by averaging Bitcoin’s price over a specific period. There are two main types:
- Simple Moving Average (SMA): Calculates the average price over a set period (e.g., 50-day SMA).
- Exponential Moving Average (EMA): Places more weight on recent prices, making it more responsive to short-term price movements.
How to Use:
- When Bitcoin’s price crosses above the moving average, it can signal a buying opportunity. When the price crosses below the moving average, it can signal a selling opportunity.
Relative Strength Index (RSI)
The RSI is a momentum indicator that measures the speed and change of price movements. It ranges from 0 to 100 and helps traders identify overbought or oversold conditions.
- Overbought (RSI > 70): Bitcoin may be overvalued, signaling a potential price drop.
- Oversold (RSI < 30): Bitcoin may be undervalued, signaling a potential price increase.
How to Use:
- Look for RSI levels above 70 for potential selling opportunities and levels below 30 for potential buying opportunities.
Bollinger Bands
Bollinger Bands consist of a moving average and two standard deviation lines above and below it. They are used to measure market volatility.
- Upper Band: Represents an overbought condition.
- Lower Band: Represents an oversold condition.
How to Use:
- If Bitcoin’s price touches or breaks through the upper band, it may signal an impending price correction. If it touches the lower band, it may indicate a buying opportunity.
Volume
Volume refers to the number of Bitcoins traded within a certain time frame. High volume often confirms the strength of a trend, while low volume can indicate a potential reversal or weak price movement.
How to Use:
- An increase in volume during a price breakout signals a strong trend.
- If price moves without accompanying volume, it may indicate a weak or unsustainable trend.
3. Identifying Trends and Patterns
Trendlines
Trendlines are simple lines drawn on a chart to show the general direction of Bitcoin’s price. There are three types of trends:
- Uptrend: Higher highs and higher lows indicate a bullish market.
- Downtrend: Lower highs and lower lows signal a bearish market.
- Sideways Trend: The market is moving within a range, with no clear direction.
How to Use:
- Draw a trendline connecting at least two highs (for downtrends) or two lows (for uptrends) to spot key levels of support or resistance.
Support and Resistance
- Support: A price level where Bitcoin tends to stop falling and may reverse upward. It acts as a “floor” for the price.
- Resistance: A price level where Bitcoin tends to stop rising and may reverse downward. It acts as a “ceiling.”
How to Use:
- When Bitcoin approaches a support level, it may present a buying opportunity. When it nears a resistance level, it may signal a good time to sell.
Popular Chart Patterns
Recognizing chart patterns can help traders predict potential price movements. Here are a few common ones:
- Head and Shoulders: A reversal pattern that signals the end of an uptrend and the start of a downtrend.
- Double Top/Double Bottom: A double top indicates a bearish reversal, while a double bottom signals a bullish reversal.
- Flags and Pennants: These are continuation patterns that occur after sharp price movements, signaling the market is likely to continue in the same direction.
4. Time Frames for Bitcoin Trading
Different time frames serve different trading strategies:
- Short-Term (1 minute to 1 hour): Ideal for day traders looking for quick profits from small price movements.
- Medium-Term (4 hours to 1 day): Suitable for swing traders who aim to capitalize on price trends over several days or weeks.
- Long-Term (1 day to 1 month): Best for investors who are focused on the bigger picture and long-term price appreciation.
Tip:
Use multiple time frames to get a comprehensive view of Bitcoin’s market. For example, a trader might look at daily charts for long-term trends while using 1-hour charts for entry points.
Conclusion: Mastering Bitcoin Trading Charts
Reading Bitcoin trading charts may seem intimidating at first, but once you understand the key elements—like candlesticks, indicators, and chart patterns—it becomes easier to interpret market trends and make informed trading decisions. By studying charts, using key technical indicators, and recognizing patterns, you’ll be better equipped to anticipate Bitcoin price movements and improve your trading outcomes.
Pro Tips:
- Start by mastering one or two charts and indicators before moving on to more complex tools.
- Practice reading charts regularly to sharpen your skills and develop your own trading strategies.
- Keep in mind that no chart is foolproof; always combine technical analysis with broader market research.